
GEO Citation Analysis: What LLMs Cite in Australia, and Why
LLM
GEO Citation Analysis: What LLMs Cite in Australia, and Why

 ChatGPT
 Claude
 Perplexity
 Grok
Grok
 Google AI
 You
You
 WhatsApp
 LinkedIn
Generative engine optimisation (GEO) starts with knowing what AI assistants cite. We logged 122,787 AI citations from 467 prompts about 12 brands we manage, then compared the most-cited pages with the rest.
Executive summary
The pages that LLMs cite most are fresh, written for Australia, easy to read, and often a best-of roundup. Domain authority matters far less than we expected.
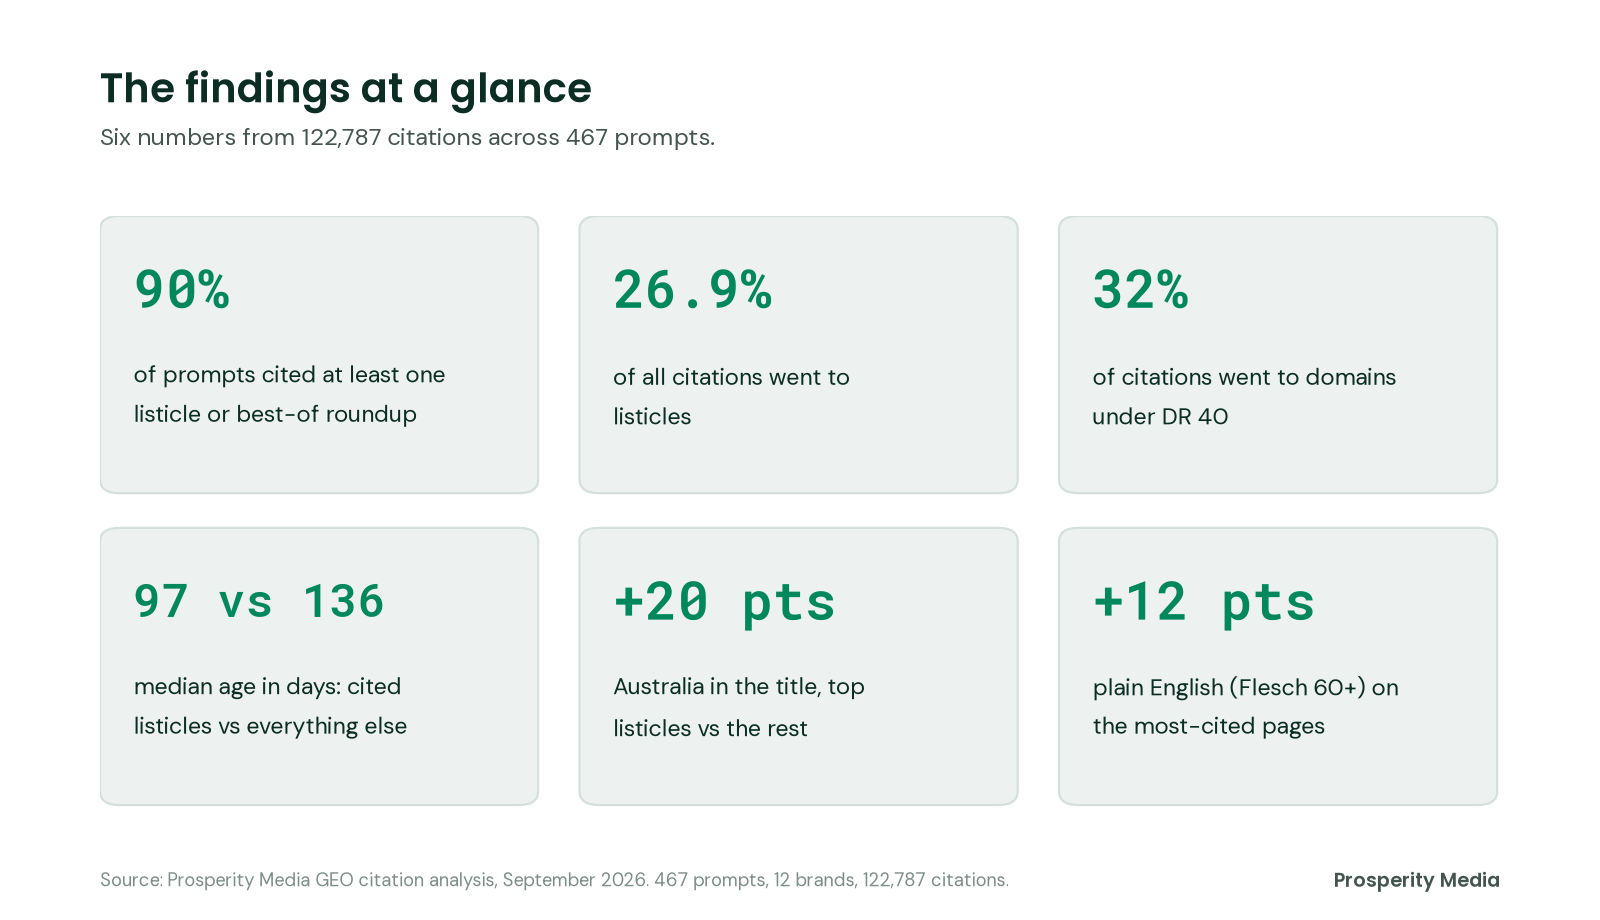
- Listicles show up in almost every prompt. 90% of prompts cited at least one listicle or best-of roundup. Listicles took 26.9% of all citations, and 49% on best / top prompts.
- Domain authority does not decide who gets cited. The most-cited quartile of listicles sits on domains with a median Domain Rating (DR) of 43, against 53 for the rest. Domains under DR 40 receive 32% of all citations.
- Fresh pages win. Cited listicles have a median age of 97 days, against 136 for everything else. Almost half (48.8%) of listicle citations go to pages with 2026 in the title.
- Local signals separate the winners. Australia appears in the title of 55% of the most-cited listicles and 35% of the rest, a 20-point gap. .com.au domains show a similar 17-point lift.
- Plain English helps. Pages with a Flesch reading ease score of 60 or more are 12 points more common among the most-cited pages.
- Schema and heading structure do not separate winners from the rest. 90% of cited pages carry schema. Only about half have a clean heading hierarchy, and the top performers are no cleaner.
- Own-domain share varies by industry. B2B software and services brands earn 33% of citations on their own sites. Retail and consumer goods brands earn 1.1% and lose ground to affiliate and review sites.
How we ran the test
We ran 467 real-world prompts through our GEO citation tracker and logged every URL the LLMs cited, which gave us 122,787 LLM citations to analyse. We then crawled and enriched those URLs to find what the most-cited pages have in common.
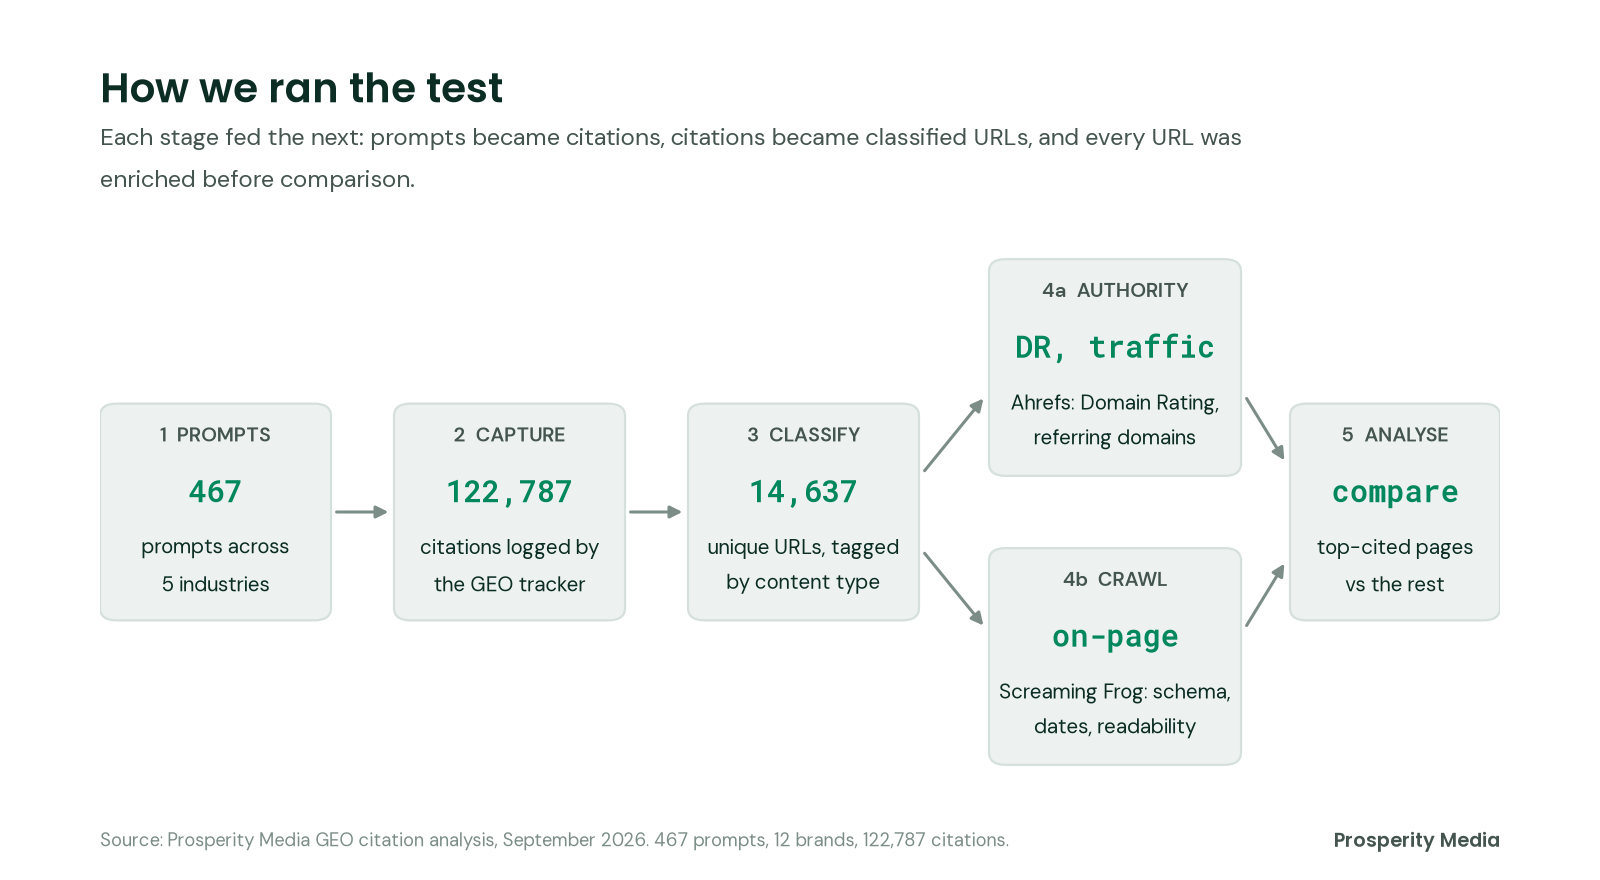
Prompts produced citations. We grouped the citations into URLs and content types, then enriched each URL with authority and on-page data before comparing them.
Scope
| Measure | Value |
|---|---|
| Brands (clients and competitors) | 12 |
| Prompts with citations | 467 |
| Total citations logged | 122,787 |
| Unique cited URLs | 14,637 |
| Unique cited domains (top 300 analysed) | 300 hold 63% of citations |
| Citations per prompt | median 236, range 69 to 725 |
| Pages crawled and returning HTTP 200 | 10,318 |
| Pages in the heading and schema deep-dive | 2,835 |
Prompts by industry
To protect client confidentiality, we grouped the 12 brands into five industry segments. Each segment holds two or three brands, and figures are totals or citation-weighted averages across them.
| Industry segment | Brands | Prompts | Citations |
|---|---|---|---|
| Insurance | 3 | 125 | 30,841 |
| Banking & property | 2 | 124 | 17,177 |
| Retail & consumer goods | 3 | 103 | 47,203 |
| Health & family services | 2 | 72 | 17,148 |
| B2B software & services | 2 | 43 | 10,418 |
| Total | 12 | 467 | 122,787 |
Step by step
- We wrote a prompt set that mirrors how customers ask AI assistants about each brand’s category. It holds “best X in Australia” queries (135), comparison and alternatives queries (53), open questions (203) and other phrasing (76).
- Our GEO citation tracker ran every prompt and recorded each cited URL, how many times it was cited, and across how many prompts and brands.
- We tagged every URL as one of: best-of roundup, numbered or top-N listicle, comparison, review, news or article, forum or UGC, homepage, directory, or other page. Best-of and numbered pages together form the listicle group.
- We matched each cited domain to its Ahrefs Domain Rating, Ahrefs rank, referring domains and organic traffic.
- Screaming Frog crawled the cited URLs to capture titles, H1 to H4 structure, meta descriptions, canonicals, robots directives, schema types, word count, readability, outbound links, response time and publish or modified dates.
- We took page age from Screaming Frog modified dates first, then published dates, <time> tags and URL paths. Only 43% of URLs carried a usable date.
- We compared listicles with non-listicles, the most-cited quartile of listicles with the rest, and the top 10% most-cited pages with everything else.
This report does not split results by platform, because the export pools citations across AI engines.
Finding 1: Listicles are the default source for commercial prompts
Listicles and best-of roundups appeared in 421 of 467 prompts (90%) and took 26.9% of all citations. In 65 prompts (14%), they took more than half of the citations.
How much listicles matter depends on prompt intent
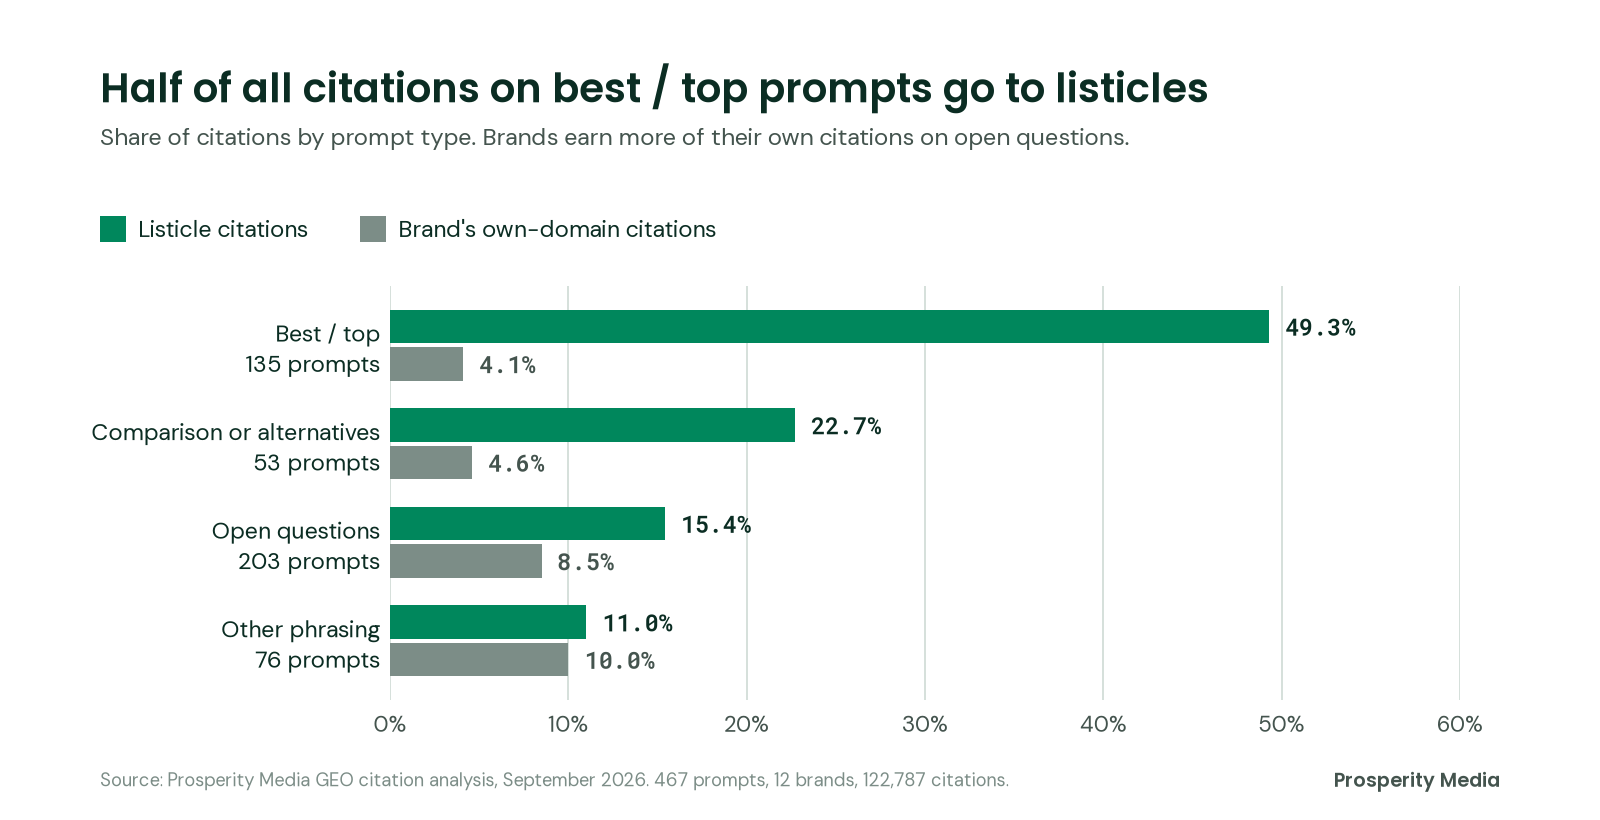
On best / top prompts, half of everything cited is a listicle, and brand sites win just 4% of citations. Brands earn more of their own citations on informational questions, where guides and FAQs compete.
| Prompt intent | Prompts | Citations | % listicle citations | % own-domain citations |
|---|---|---|---|---|
| Best / top prompts | 135 | 40,157 | 49.3% | 4.1% |
| Comparison or alternatives | 53 | 17,655 | 22.7% | 4.6% |
| Open questions (how, what, which) | 203 | 46,443 | 15.4% | 8.5% |
| Other phrasing | 76 | 18,532 | 11.0% | 10.0% |
The most listicle-heavy prompts were retail “best mattress in Australia” queries, where 85% to 95% of citations went to listicles. B2B “best alternatives to [software]” and “top agencies” prompts followed the same pattern at 83% to 90%.
Citation rate by content type (top 5,000 cited URLs)
| Content type | URLs | Citations | Avg citations per URL | Median age (days) |
|---|---|---|---|---|
| Review | 133 | 3,182 | 23.9 | 122 |
| Numbered / top-N listicle | 361 | 8,549 | 23.7 | 126 |
| Best-of roundup | 852 | 19,361 | 22.7 | 87 |
| Homepage | 146 | 3,316 | 22.7 | 59 |
| Comparison | 460 | 9,333 | 20.3 | 136 |
| News / article | 103 | 2,015 | 19.6 | 84 |
| Forum / UGC | 190 | 3,296 | 17.3 | 117 |
| Directory / listing | 40 | 651 | 16.3 | 212 |
| Other page | 2,715 | 43,748 | 16.1 | 143 |
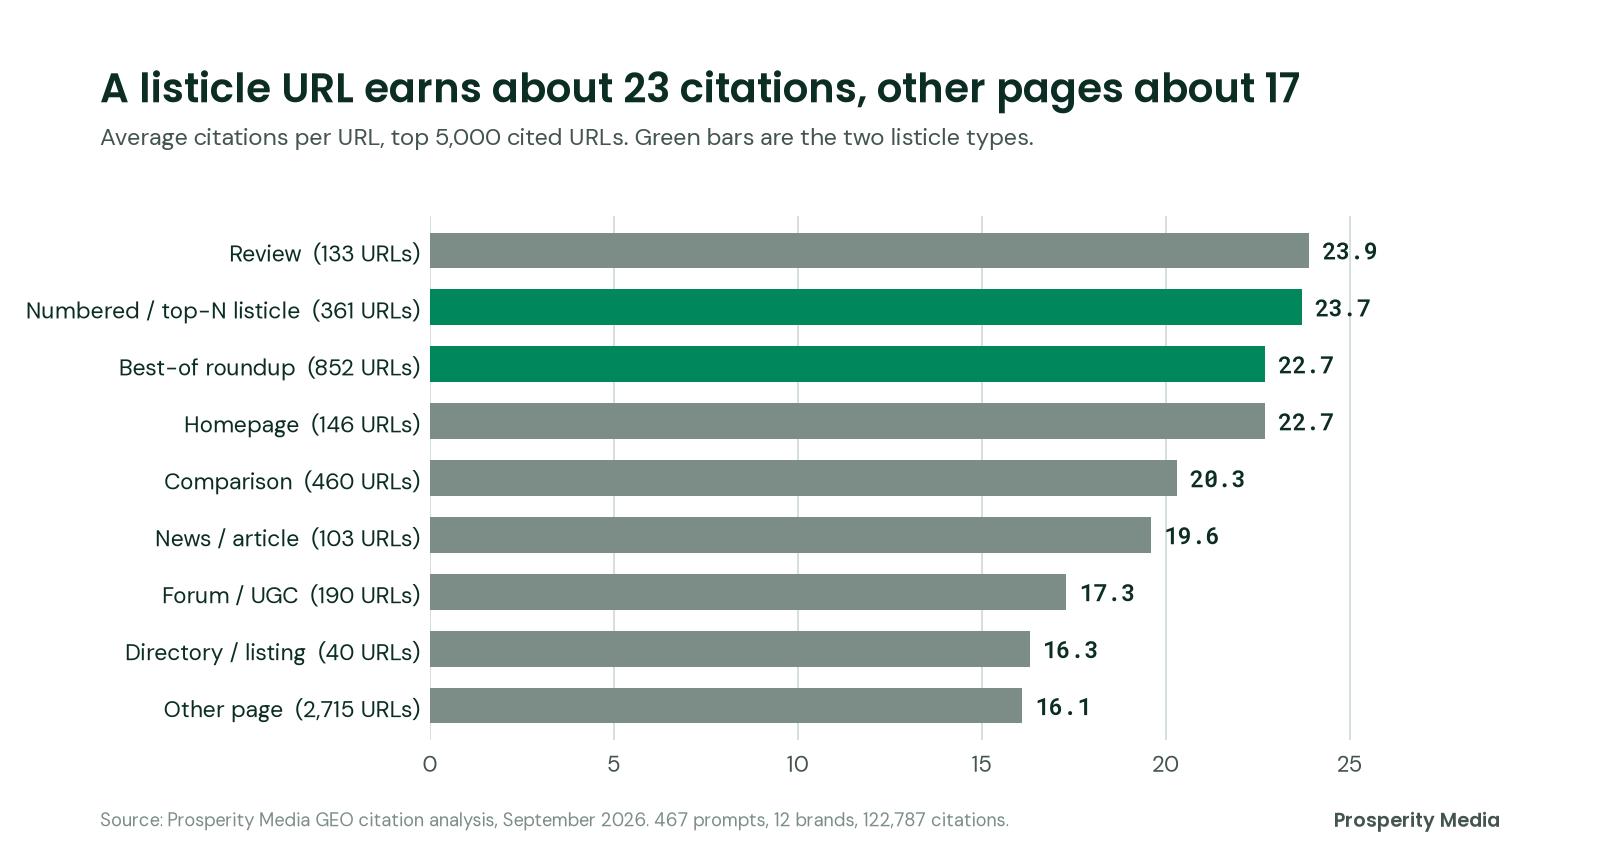
A listicle URL earns about 23 citations on average against 17 for a non-listicle, roughly a third more. Reviews earn slightly more per URL, but there are far fewer of them (133 URLs against 1,213 listicle URLs). By volume, best-of roundups took 18.5% of all citations and numbered top-N lists 8.4%, so the “best X in Australia” roundup is the bigger opportunity.
Finding 2: Every industry plays differently
Listicle reliance ranges from 13% of citations in health and family services to 39% in retail, and own-site share ranges from 1.1% in retail to 33% in B2B.
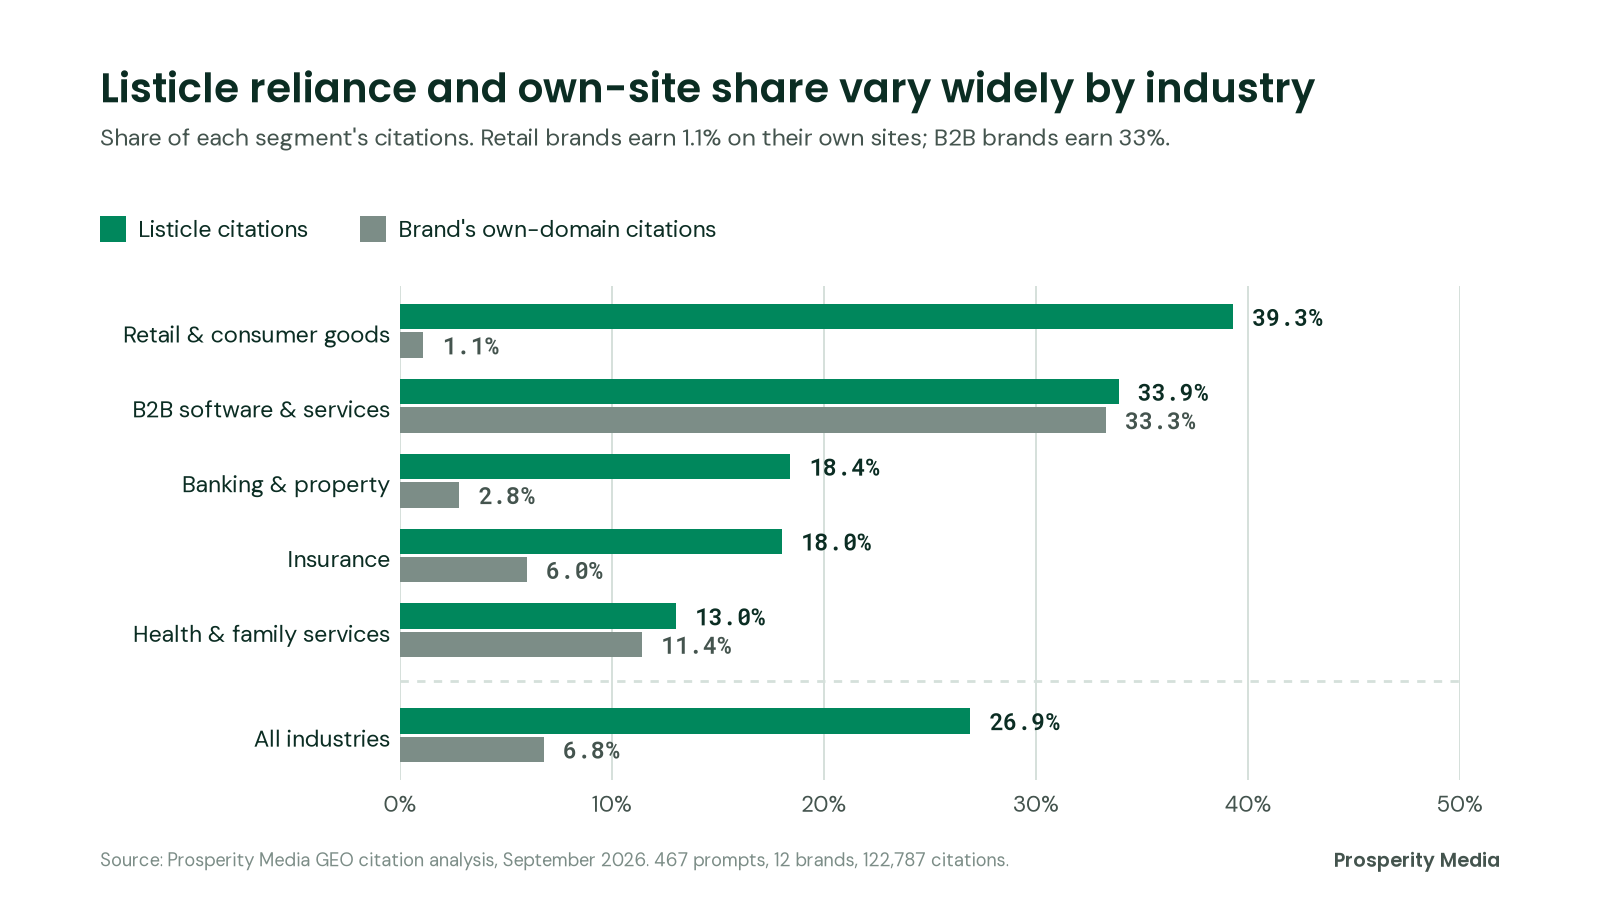
| Industry segment | Prompts | Citations | % listicle | % prompts listicle-dominated | % own-domain |
|---|---|---|---|---|---|
| Retail & consumer goods | 103 | 47,203 | 39.3% | 29.1% | 1.1% |
| B2B software & services | 43 | 10,418 | 33.9% | 25.6% | 33.3% |
| Banking & property | 124 | 17,177 | 18.4% | 12.9% | 2.8% |
| Insurance | 125 | 30,841 | 18.0% | 4.8% | 6.0% |
| Health & family services | 72 | 17,148 | 13.0% | 2.8% | 11.4% |
| All industries | 467 | 122,787 | 26.9% | 13.9% | 6.8% |
In the table above, listicle-dominated means that listicles took 50% or more of that prompt’s citations.
What stands out
- Retail and consumer goods are listicle territory. Roundups dominate almost a third of retail prompts (29.1%), and brand sites win just 1.1% of citations. Getting placed in those lists matters more than ranking the brand site.
- B2B buyers get lists too. “Best alternatives” and “top agencies” prompts lean heavily on roundups. Brand sites still win a third of citations, though much of that comes from our own agency site.
- Banking, property and insurance lean on aggregators. Listicle share is lower because comparison sites such as Finder, Canstar and Choice fill the gap.
- Service brands can win on their own content. Health and family services brands earn 11.4% of citations on their own sites with little listicle competition, so owned guides and FAQs are the main lever.
- Brand authority does not predict own-site citations. In four of the five segments, the lowest-DR brand earned the highest share of citations on its own domain.
Finding 3: Domain authority is not the gate
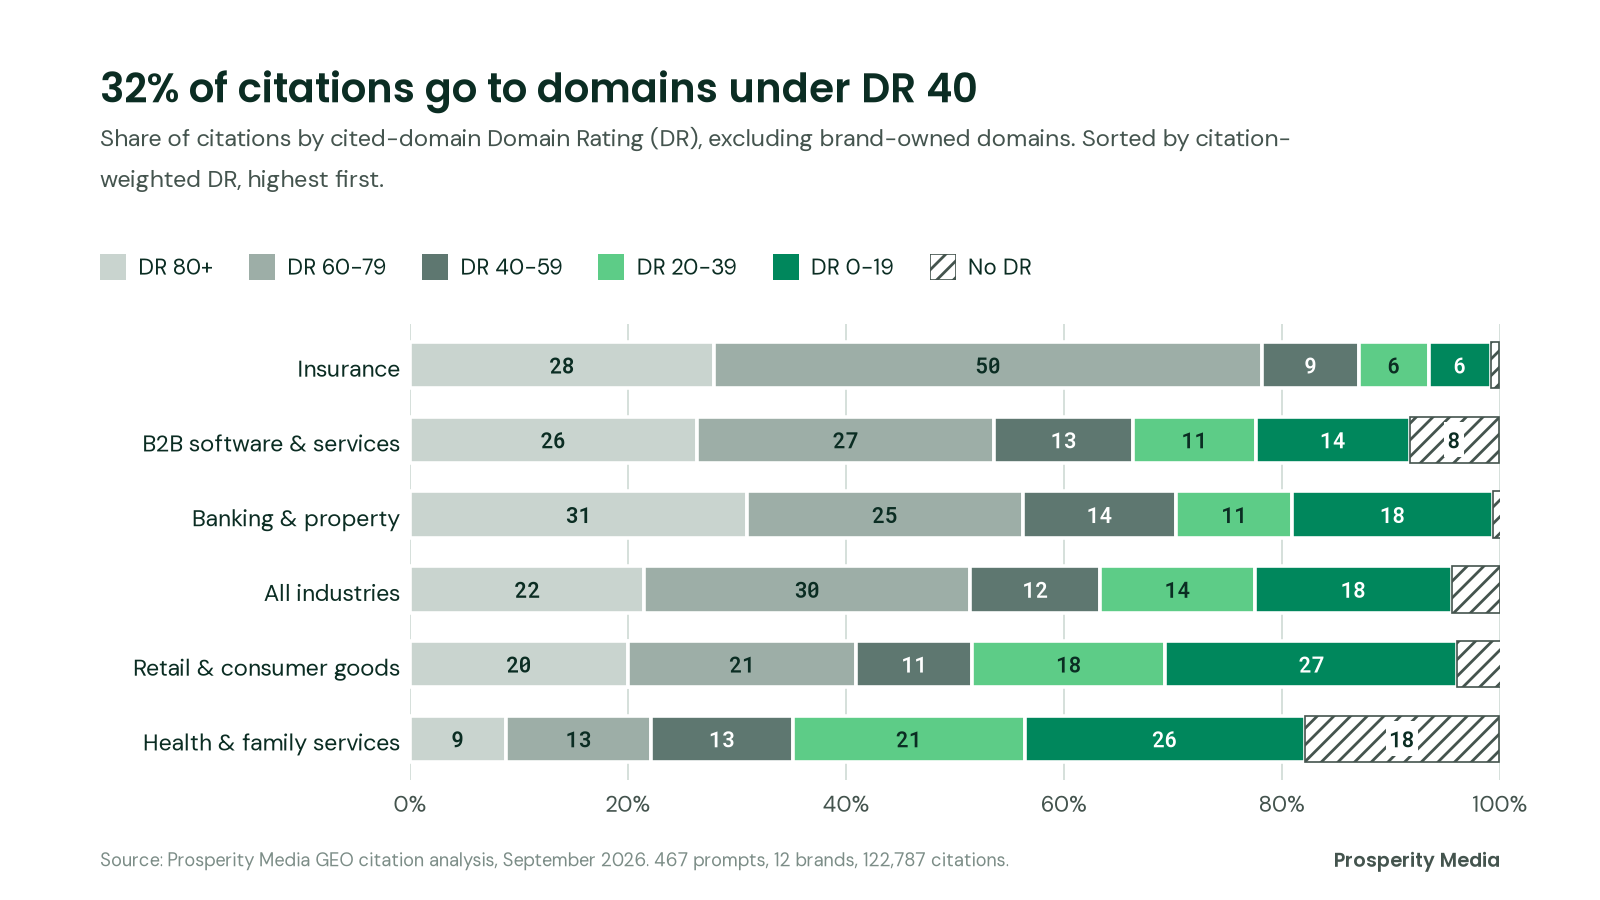
The citation-weighted DR of cited domains is 54 across all brands, and 32% of citations go to domains under DR 40. Among listicles, the most-cited quartile sits on lower-DR domains (median 43) than the rest (median 53).
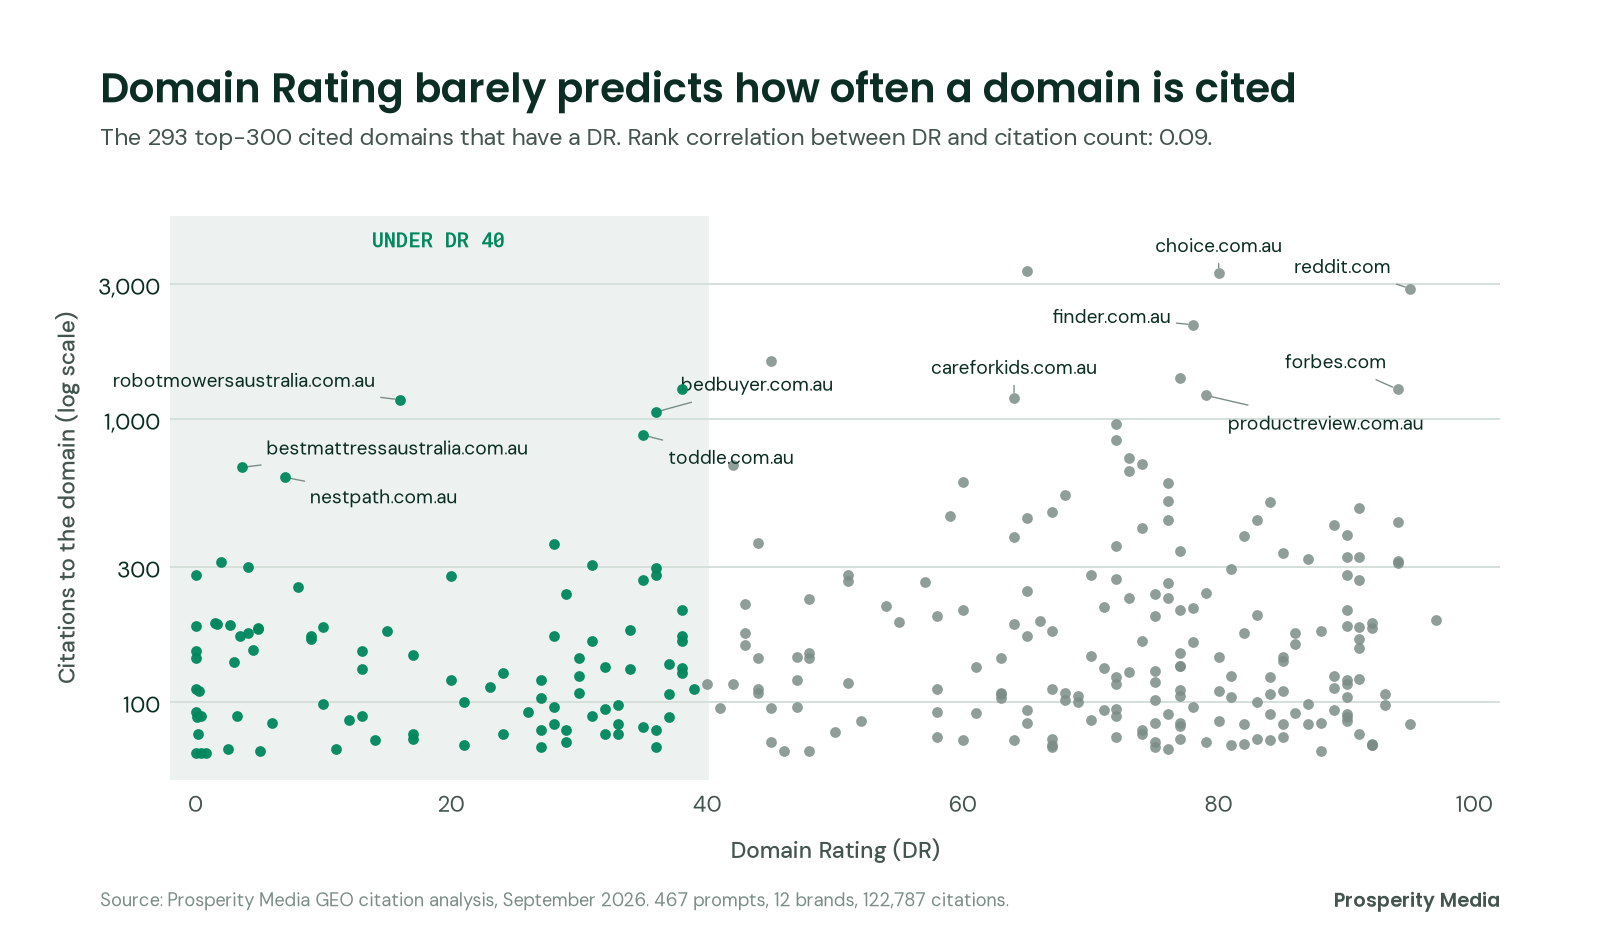
Across the 293 top-300 cited domains that have a DR, the rank correlation between DR and citation count is 0.09, which is negligible.
Authority expectations depend on the industry. Insurance prompts pull 78% of citations from DR 60+ publishers, insurers and comparison sites. Health and family services prompts pull heavily from small niche sites: 47% of citations go to domains under DR 40 and 18% to sites with no DR at all.
Niche sites with a modest DR win when they are specific. Examples from the top 30 cited domains:
| Domain | DR | Citations | % listicle |
|---|---|---|---|
| bestmattressaustralia.com.au | 4 | 672 | 78.9% |
| nestpath.com.au | 7 | 620 | 98.1% |
| robotmowersaustralia.com.au | 16 | 1,165 | 20.3% |
| toddle.com.au | 35 | 874 | 0.0% |
| bedbuyer.com.au | 36 | 1,055 | 59.7% |
| kindicare.com | 42 | 683 | 64.3% |
These sites are narrowly focused, Australian and built around buying-decision content. For clients, this means a well-built category page or roundup can earn citations without a high-DR domain.
Finding 4: Fresh pages and the current year win
The median cited page is 127 days old, and cited listicles are younger still at 97 days, against 136 for everything else. 54% of listicle citations go to pages updated in the last 90 days.
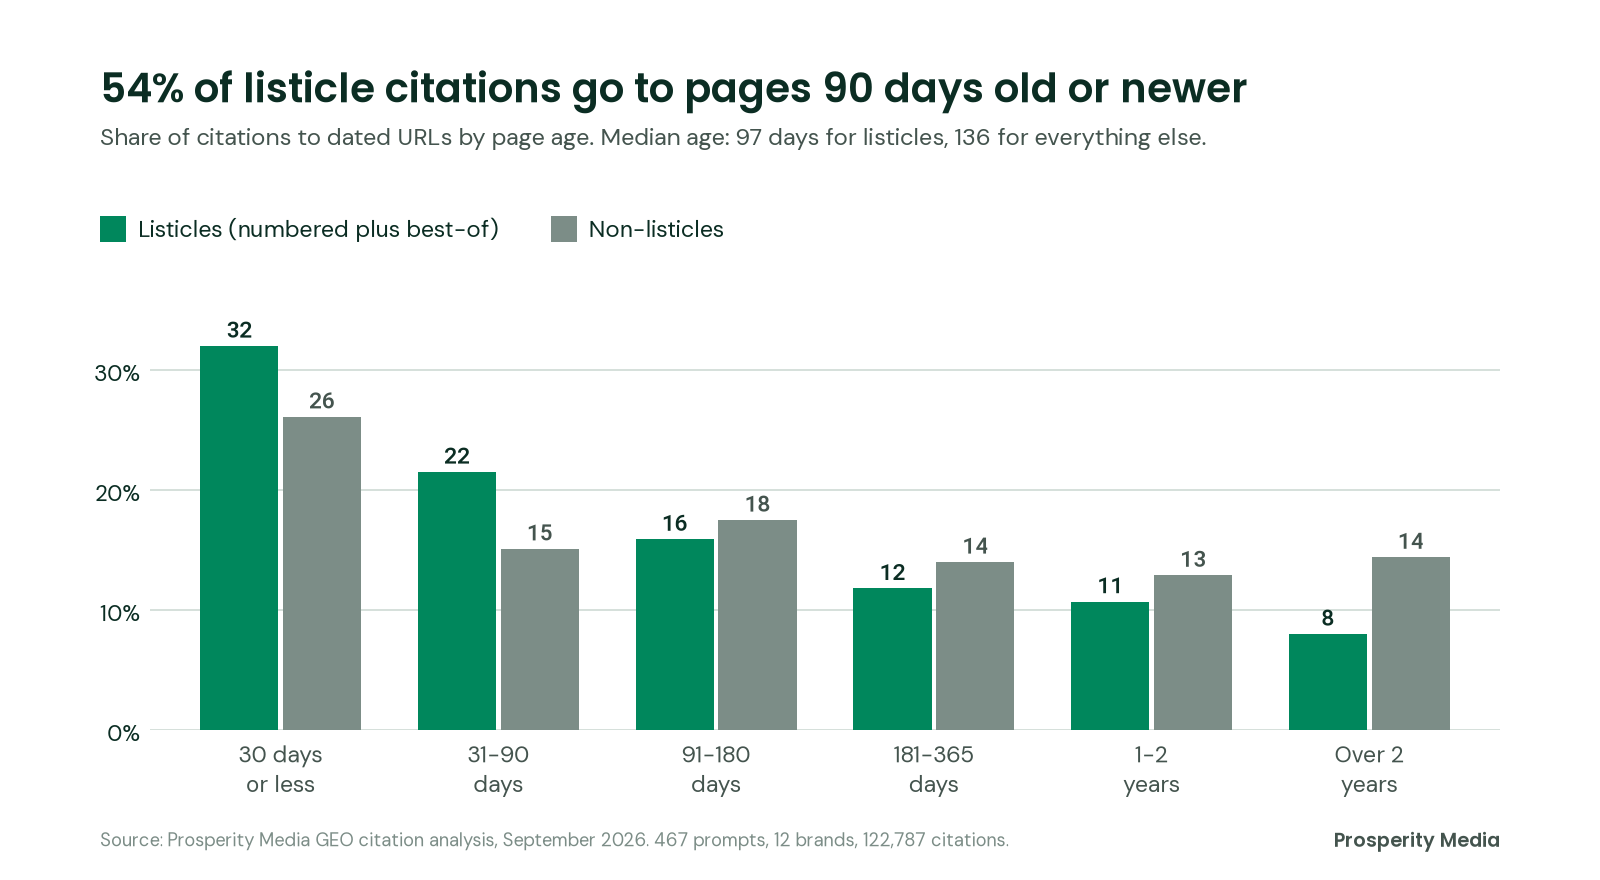
Listicles skew towards recent updates, while non-listicles carry a long tail of pages more than two years old. Forum pages are the exception: 45% of their dated citations go to pages more than two years old (from a small dated sample of 51 URLs), so LLMs still cite old threads when they answer a specific question.
The year in the title
- 48.8% of listicle citations go to pages with 2026 in the title, against 10.4% for non-listicles.
- Half of listicles (50.2%) put a year in the title, and 36.4% repeat it in the H1.
- Among the top 5,000 cited URLs, 747 titles say 2026 and only 117 say 2025. Outdated years are rare among cited pages.
Is the 2026 claim real?
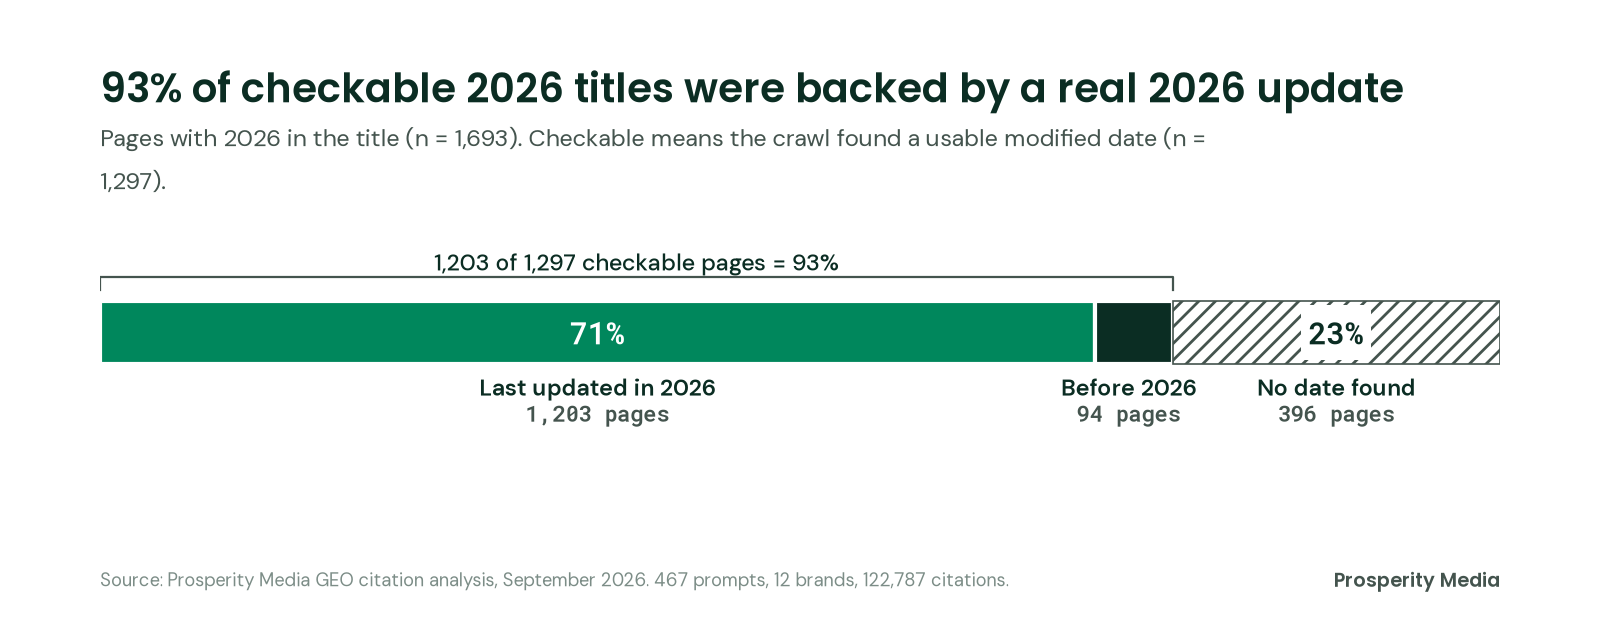
93% of checkable 2026 pages carried a genuine 2026 update. LLMs appear to reward real refreshes rather than a changed title, so an update should touch the content and the modified date.
| Pages with 2026 in the title | Pages |
|---|---|
| Total | 1,693 |
| With a checkable date | 1,297 |
| Actually updated in 2026 | 1,203 |
| Last updated before 2026 (claim not backed) | 94 |
| No date found | 396 |
Freshness by industry
Insurance prompts pull the freshest sources, with 35% of dated citations going to pages under 30 days old. Retail and consumer goods pull the oldest, with 15% of citations to pages over two years old and brand-level median ages up to 427 days. B2B prompts cluster in the recent past, with 57% of citations to pages under 90 days old.
Finding 5: Structure and schema do not set winners apart
90% of cited pages carry schema and 89% use exactly one H1, but the most-cited listicles are no cleaner than the rest. These are entry requirements. They do not explain why a page wins.
Heading structure (2,835 pages crawled in depth)
| Measure | Listicles: most-cited quartile | Listicles: rest | Non-listicles |
|---|---|---|---|
| Exactly one H1 | 91.5% | 89.6% | 86.1% |
| Clean heading hierarchy | 47.8% | 52.4% | 42.6% |
| Any skipped heading level | 35.7% | 32.3% | 37.7% |
| Median H2s / H3s | 10 / 13 | 9 / 13 | 9 / 9 |
| Uses H4 or deeper | 62.5% | 56.4% | 55.7% |
| Items as numbered headings | 34.2% | 33.4% | 12.7% |
| 2+ question-style headings | 58.8% | 53.7% | 55.6% |
| Has a table | 48.2% | 44.2% | 27.9% |
| Has an ordered list | 40.4% | 44.5% | 36.3% |
| Avg citations per page | 55.0 | 6.7 | 37.2 |
The most-cited listicles are slightly deeper, with more H2s, more H4s and more comparison tables. A clean hierarchy shows no lift, so heading hygiene alone will not move citations.
Schema
| Schema type | Listicles: most-cited quartile | Listicles: rest | Non-listicles |
|---|---|---|---|
| Any schema | 91.2% | 91.2% | 85.1% |
| Organization | 74.6% | 71.1% | 59.7% |
| Article-type | 65.8% | 65.2% | 37.0% |
| Person (author) | 65.4% | 59.0% | 38.4% |
| BreadcrumbList | 58.5% | 63.0% | 57.5% |
| FAQPage | 35.7% | 31.1% | 23.5% |
| ItemList | 13.2% | 16.0% | 4.6% |
| Review / Rating | 10.3% | 10.6% | 9.8% |
| Product | 6.6% | 8.2% | 4.5% |
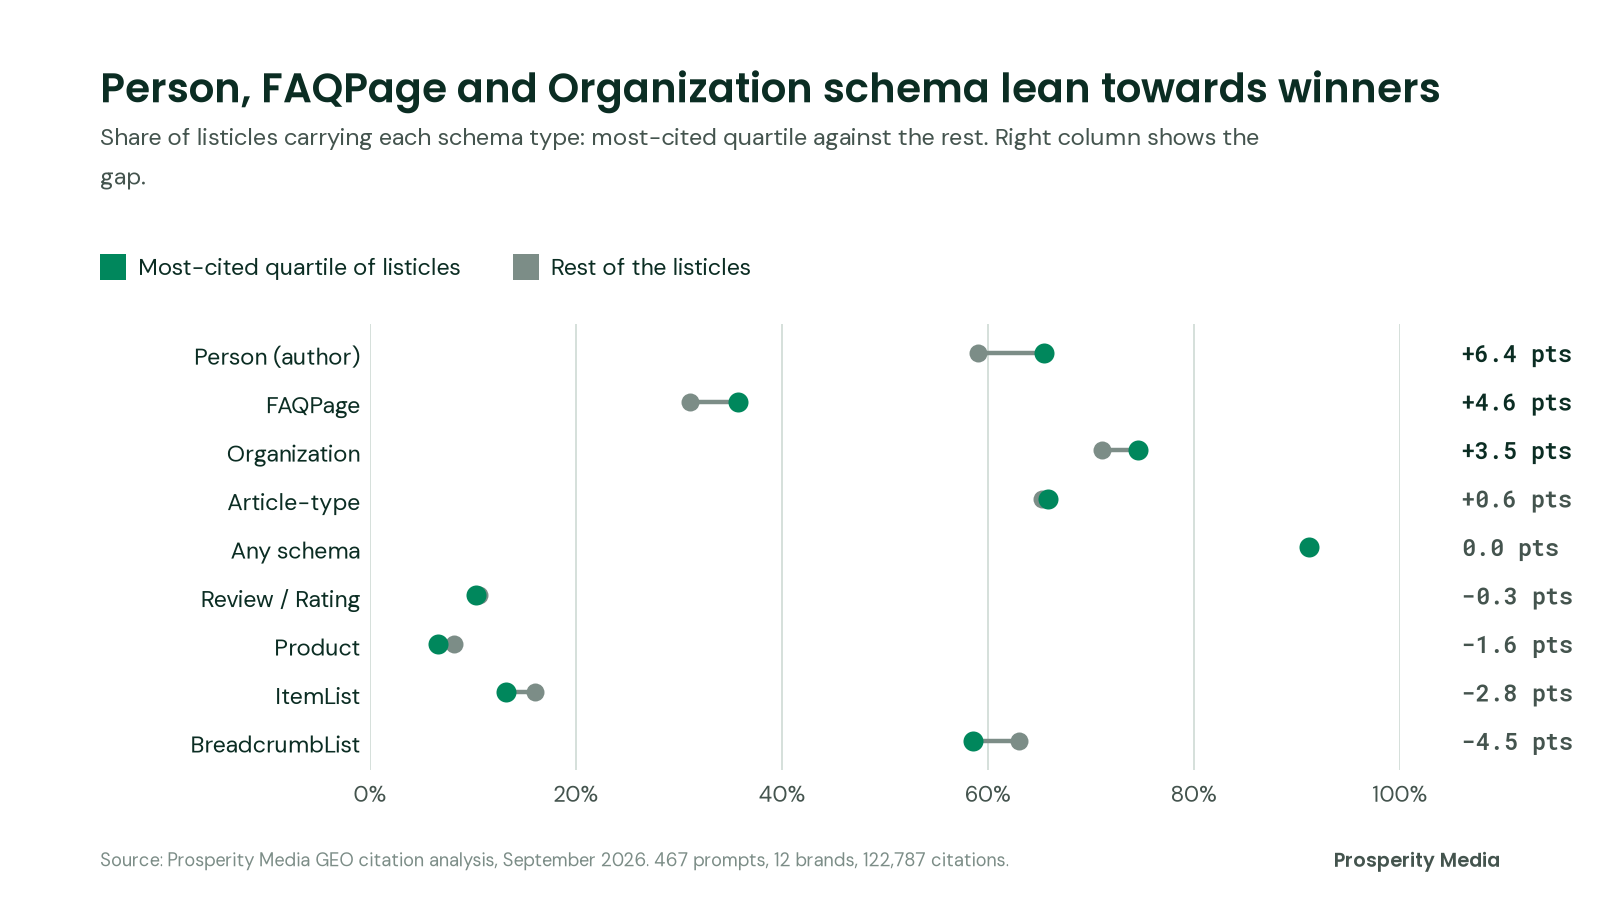
Three types lean towards the winners: Person author markup (+6.4 points), FAQPage (+4.6) and Organization (+3.5). All three are trust and entity signals, which is consistent with LLMs favouring content that has a named author and a clear publisher.
ItemList, the schema built for ranked lists, is used by only 13% of the top listicles, and the rest of the listicles use it slightly more often (16%). It is not a requirement for citation, though it remains cheap to add.
Finding 6: The SEO elements the most-cited pages share
The strongest separators are Australian localisation, plain-English writing and best / top framing. High-DR .com domains are less common among the most-cited pages.
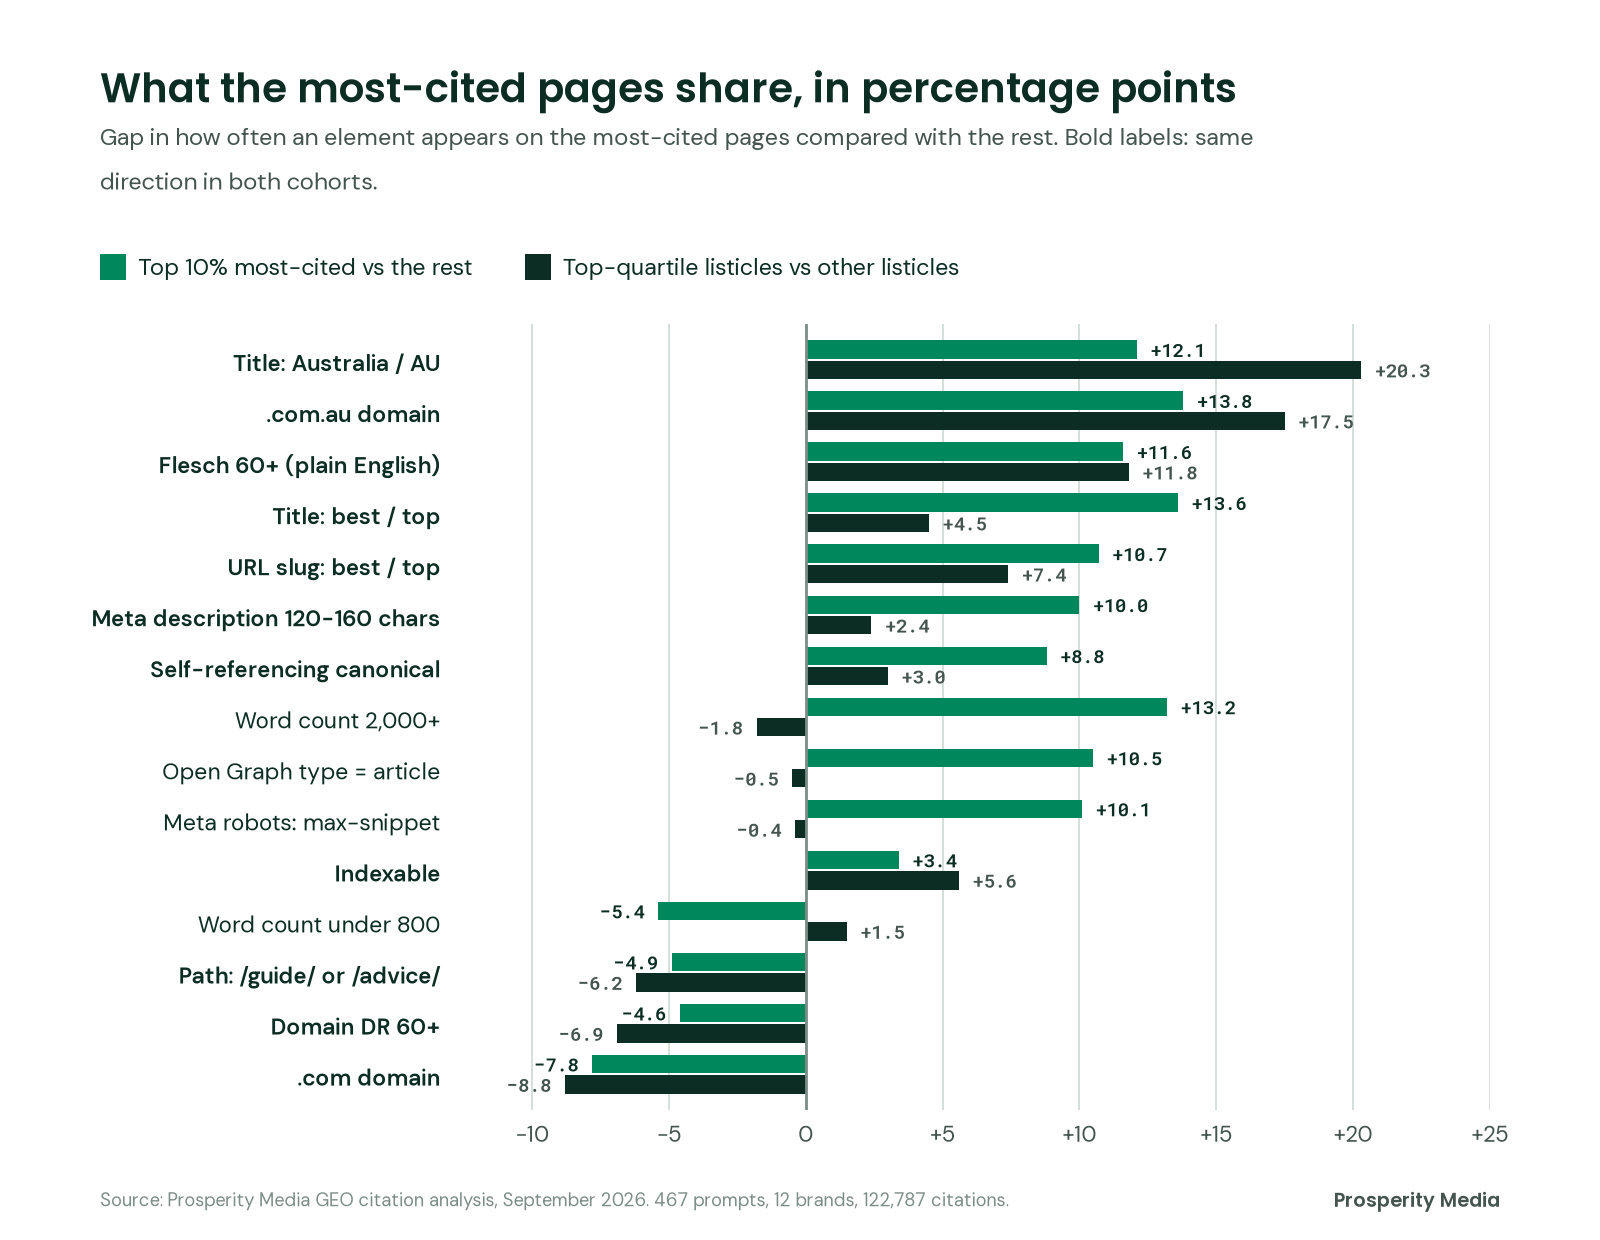
The chart compares two cohorts: the top 10% most-cited pages against all other cited pages, and the most-cited quartile of listicles against the other listicles. An element with a positive gap in both cohorts is a consistent signal.
Consistent positive signals
- Australian localisation. Australia or AU in the title and a .com.au domain lead in both cohorts, by 12 to 20 points.
- Plain English. A Flesch reading ease of 60+ is 12 points more common in both cohorts. Top-quartile listicles have a median Flesch of 72 against 66 for the rest.
- Best framing in the URL and title. Slugs containing best or top lead by 7 to 11 points.
- Crawl and index hygiene. Self-referencing canonicals and indexable status are more common among winners, and 95% of top-quartile listicles have a self-referencing canonical.
Consistent negative signals
- .com and high-DR domains. Global .com domains and DR 60+ domains are less common among the most-cited pages, which matches Finding 3.
- /guide/ and /advice/ folders. Pages in guide or advice folders are less likely to be top-cited, which suggests category or best URLs beat generic guide hubs.
Median page profile
| Measure (median) | Top 10% most-cited | All other cited pages |
|---|---|---|
| Word count | 2,040 | 1,580 |
| Flesch reading ease | 70.4 | 67.6 |
| Unique outbound links | 59 | 52 |
| Page size (KB) | 262 | 209 |
| Title length (chars) | 56 | 57 |
| Meta description length (chars) | 149 | 149 |
| Domain DR | 52 | 60 |
| Response time (s) | 0.4 | 0.4 |
The typical top-cited page is longer (about 2,000 words), easier to read, links out more, and sits on a mid-authority domain. Title and meta description length show no difference, so they are not levers for citation.
Finding 7: A small set of domains takes a large share
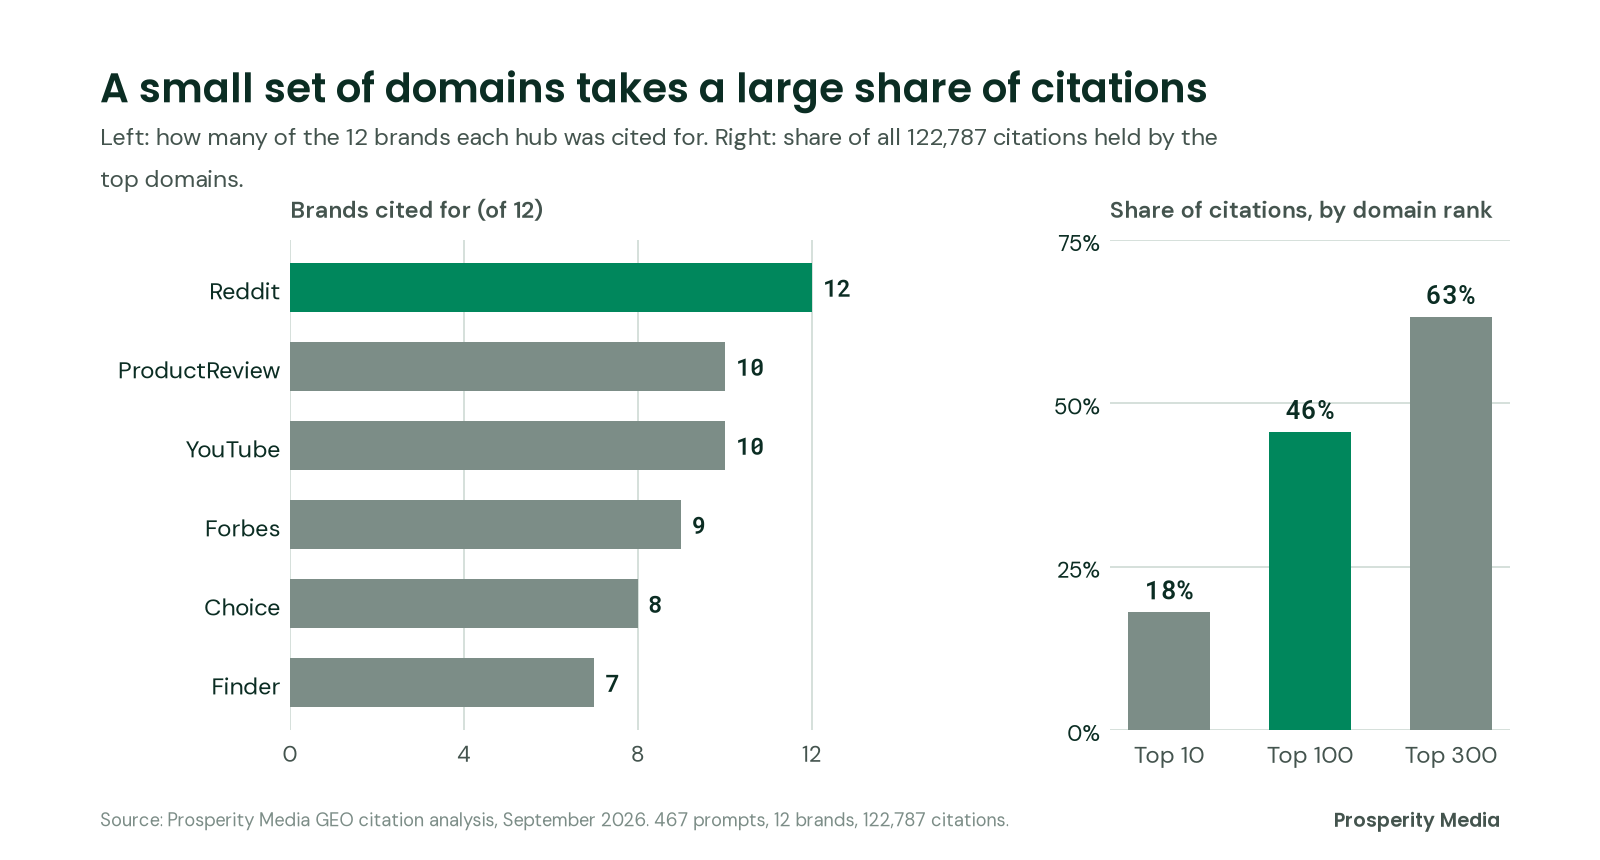
The top 10 domains take 18% of all citations and the top 100 take 46%. A handful of Australian comparison and consumer sites appear across most categories.
We anonymised brand-owned domains in the tracked set, apart from our own site.
| Domain | Citations | Unique URLs | Brands cited for | % listicle | DR |
|---|---|---|---|---|---|
| google.com | 3,716 | 549 | 8 | 0.6% | n/a |
| prosperitymedia.com.au (our site) | 3,334 | 95 | 1 | 17.2% | 65 |
| choice.com.au | 3,261 | 142 | 8 | 39.7% | 80 |
| reddit.com | 2,877 | 362 | 12 | 0.0% | 95 |
| finder.com.au | 2,145 | 119 | 7 | 26.1% | 78 |
| Brand site (health & family services) | 1,597 | 79 | 1 | 12.5% | n/a |
| canstar.com.au | 1,396 | 99 | 7 | 25.3% | 77 |
| Brand site (insurance) | 1,276 | 87 | 1 | 0.2% | n/a |
| forbes.com | 1,268 | 103 | 9 | 54.2% | 94 |
| productreview.com.au | 1,208 | 57 | 10 | 0.0% | 79 |
| careforkids.com.au | 1,183 | 141 | 1 | 2.3% | 64 |
| robotmowersaustralia.com.au | 1,165 | 38 | 1 | 20.3% | 16 |
| bedbuyer.com.au | 1,055 | 39 | 1 | 59.7% | 36 |
| au.koala.com | 960 | 52 | 1 | 51.8% | 72 |
| toddle.com.au | 874 | 68 | 1 | 0.0% | 35 |
How to read this
- Reddit (all 12 brands), ProductReview (10), YouTube (10), Forbes (9), Choice (8) and Finder (7) show up regardless of category, and 25 domains were cited for five or more brands.
- Community and UGC matter, but less than expected. Reddit, ProductReview, YouTube, LinkedIn and Facebook together take about 4.4% of citations. Reddit is cited for every brand, so a presence there is worth building.
- Category specialists dominate their niche. Most top domains are cited for only one brand, such as careforkids.com.au for childcare and bedbuyer.com.au for mattresses. Each vertical has its own go-to sources.
- google.com is a large source. Its 3,716 citations across 549 URLs are likely Maps, Business Profile and search links, which points to Google Business Profile as a GEO lever for local categories.
- Brand sites can be top sources. Three brand sites, including our own, make the overall top 10 from their own prompts alone.
Recommendations: the GEO citation playbook
Win best / top prompts through placement on third-party roundups, and win question prompts with fresh, localised, readable owned content.
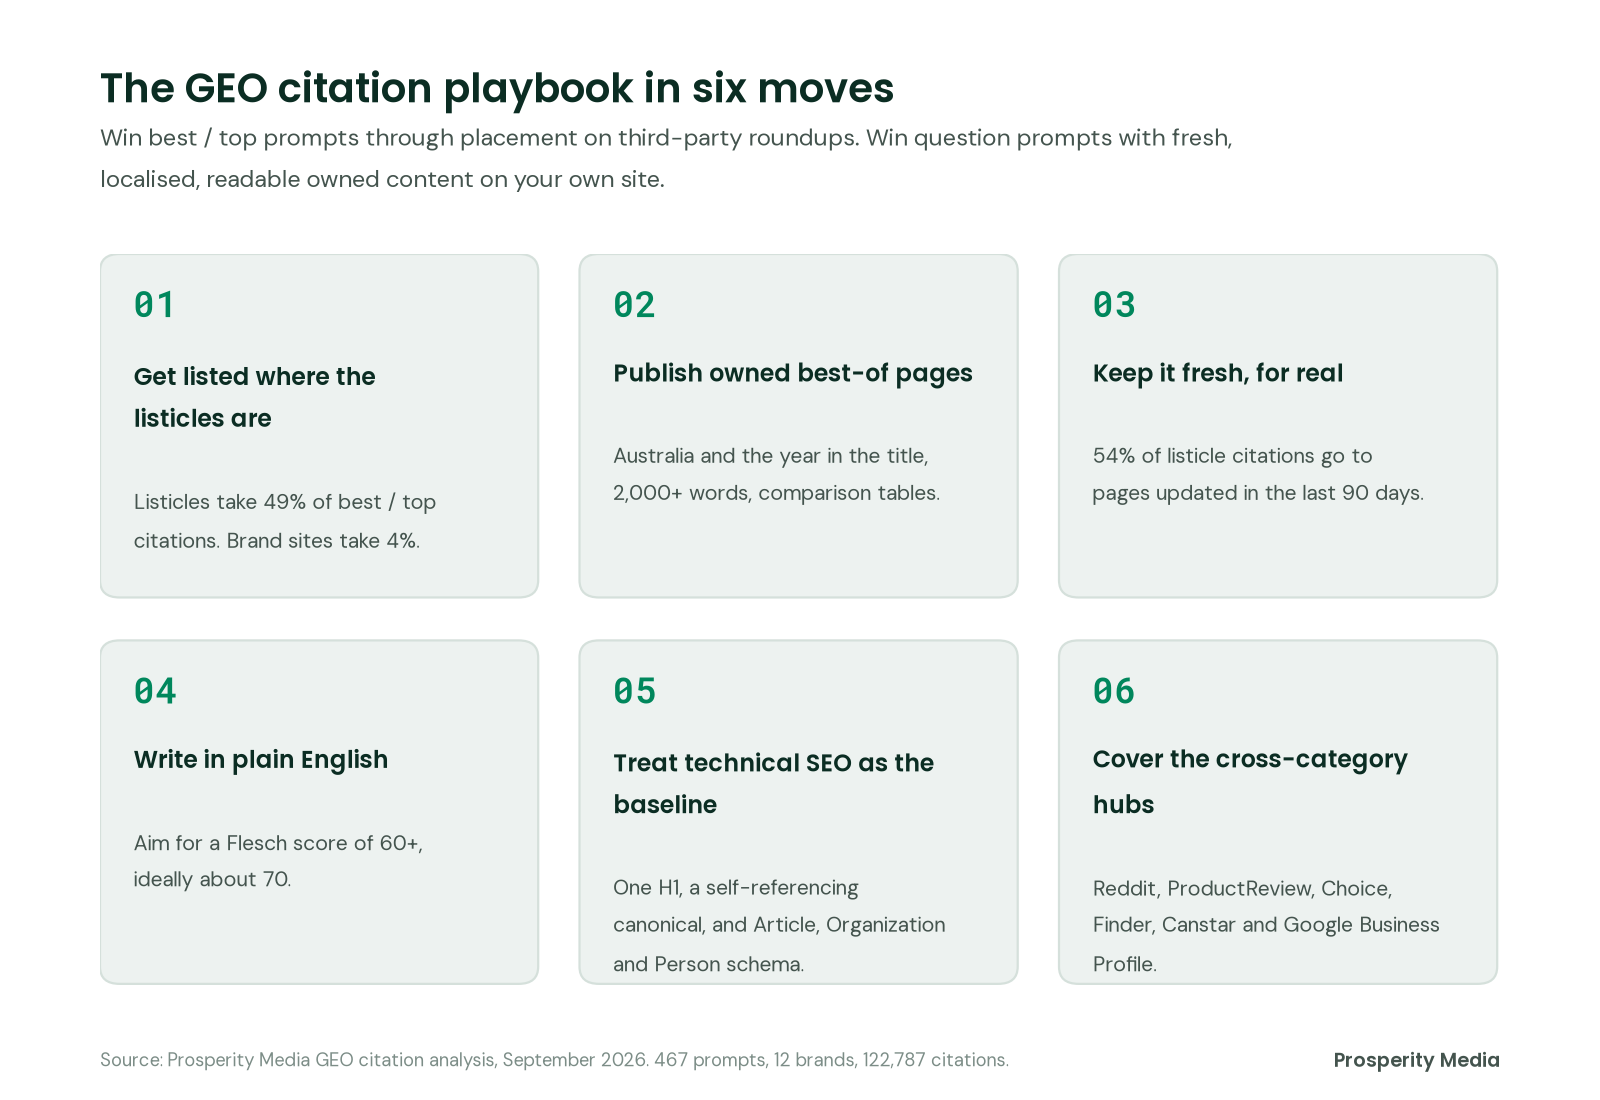
1. Get listed where the listicles are
- For retail, consumer goods and B2B software clients, prioritise digital PR and outreach to the roundups that dominate best / top prompts. On those prompts, listicles take 49% of citations and brand sites just 4%.
- Build a target list per client from the cited-URL data: the best-of pages cited across the most prompts.
- Include mid- and low-DR niche sites. bestmattressaustralia.com.au (DR 4) and nestpath.com.au (DR 7) out-cite many major publishers.
2. Publish owned best-of and comparison content
- Create Australian “best X in Australia (2026)” pages on client sites for categories where the client can credibly compare options.
- Put Australia in the title and the year in the title and H1. Use a /best- style slug rather than a /guide/ folder.
- Aim for 2,000 words or more, with comparison tables, numbered H2 items and question-style H3s.
3. Keep it fresh, and make the refresh real
- Refresh priority pages at least every 90 days. 54% of listicle citations go to pages updated in that window.
- Update the content and the modified date together. 93% of checkable 2026 pages carried a genuine 2026 update.
4. Write in plain English
- Target a Flesch reading ease of 60+ (ideally about 70). It is one of the few signals that lifts in both cohorts.
5. Treat technical SEO and schema as the baseline
- Every priority page needs one H1, a self-referencing canonical, indexable status and a 120 to 160 character meta description.
- Add Article, Organization and Person author schema as standard, plus FAQPage where there are genuine Q&As. ItemList is optional for ranked lists.
6. Cover the cross-category hubs
- Build a presence on Reddit, ProductReview, Choice, Finder and Canstar, which appear across most categories.
- Maintain Google Business Profiles for local and service clients, given google.com’s volume of citations.
Frequently asked questions
What is generative engine optimisation (GEO)?
Generative engine optimisation, also called AI search optimisation or answer engine optimisation (AEO), is the work of earning citations and mentions in answers from AI assistants such as ChatGPT, Perplexity and Gemini. This study tracks which pages those assistants cite so that brands know where to put their effort.
What do LLMs cite most often in Australia?
Listicles and best-of roundups. 90% of prompts in our data cited at least one, and listicles took 26.9% of all citations, rising to 49% on best / top prompts. Choice, Finder, Canstar, Reddit and ProductReview appear across most categories.
Does domain authority affect AI citations?
Very little in this dataset. The most-cited quartile of listicles sits on domains with a median Domain Rating (DR) of 43, against 53 for the rest, and 32% of all citations go to domains under DR 40.
How can a brand get cited by AI assistants such as ChatGPT?
Get listed on the third-party roundups that dominate best / top prompts, publish fresh Australian best-of pages with the year in the title, write in plain English, and keep the technical basics right. Our export pools citations across engines, so we cannot yet say that every assistant behaves the same way.
How is GEO different from SEO?
The technical foundations overlap: one H1, a self-referencing canonical, indexable pages and schema are the baseline for cited pages. The difference is where the wins come from. On best / top prompts, listicles take 49% of citations and brand sites take 4%, so placement on third-party roundups matters as much as ranking your own page.
Conclusions and key findings
These findings show correlation, not cause. Several data gaps need closing before we treat them as hard rules. In Australian AI answers, the winning source is usually a fresh, localised, readable roundup, and it does not need a high-authority domain. That splits the work in two: earn placement on third-party lists for best / top prompts, and publish strong owned content for question prompts.
Key findings
- Listicles are the default commercial source. 90% of prompts cited one, listicles took 26.9% of citations, and on best / top prompts they took 49% while brand sites took 4%.
- Authority is a weak filter. 32% of citations go to domains under DR 40, and the most-cited quartile of listicles has a median DR of 43 against 53 for the rest.
- Freshness counts, and the refresh has to be real. Cited listicles have a median age of 97 days against 136, 54% of their citations go to pages updated in the last 90 days, and 93% of checkable 2026 titles had a genuine 2026 update behind them.
- Local and readable beats global and dense. Australia in the title (+20 points), a .com.au domain (+17) and a Flesch score of 60+ (+12) all lift, while .com and DR 60+ domains are less common among the winners.
- Technical SEO and schema get a page into the running, not to the top. 90% of cited pages carry schema, and only Person (+6.4 points), FAQPage (+4.6) and Organization (+3.5) lean towards the most-cited listicles.
- Industry sets the play. Retail earns 39% of its citations from listicles and 1.1% on its own sites. B2B earns 33.9% from listicles and 33.3% on its own sites. Health and family services earns 13.0% and 11.4%.
- A few domains hold a large share. The top 10 take 18% of citations and the top 100 take 46%, and Reddit was cited for all 12 brands.
Start with the roundups your category already trusts. Then refresh your own best-of pages every 90 days with real changes, and re-run this prompt set monthly to see what moves. Because the results are correlations from a single run, treat each recommendation as a test to confirm on your own pages.
